Have you ever felt the weight of uncertainty when launching a new venture? That moment when you wonder: “Will my idea resonate? Can I price this right?” As professionals, we’ve all faced the challenge of balancing ambition with practicality. But what if you could turn uncertainty into confidence?
Umalis’ Revenue Simulator transforms how businesses evaluate opportunities. By integrating real-time trends and consumer behavior patterns, it provides clarity in an often unpredictable landscape. Imagine knowing exactly how your offering could perform before investing time and resources.
This tool doesn’t just crunch numbers—it reveals strategic insights. For instance, when analyzing online competition, the simulator identifies gaps where your product can thrive. It assesses price sensitivity, forecasts revenue potential, and even highlights growth pathways tailored to your goals.
Why does this matter? Because success starts with understanding. Whether refining a service or launching a new solution, data-driven decisions minimize risk and maximize impact. With Umalis’ expertise, you’re not just guessing—you’re building with precision.
Table of Contents
Key Takeaways
- Umalis’ simulator predicts sales potential using advanced market research.
- Real-time data analysis helps optimize pricing strategies.
- Assess product viability before committing resources.
- Gain actionable insights into consumer preferences.
- Forecast growth opportunities with 90%+ accuracy.
Introduction to Market Demand Analysis
How do you measure genuine interest in your product? Understanding purchasing behavior starts with foundational concepts that reveal how consumers interact with your offerings. Let’s explore the tools that turn raw data into actionable strategies.
What is Market Demand?
Market demand represents the total quantity of a product or service people will buy at varying prices. For example, if 1,000 customers each purchase three units monthly, the total quantity demanded is 3,000 units. This figure shifts based on factors like income levels or competitor activity.
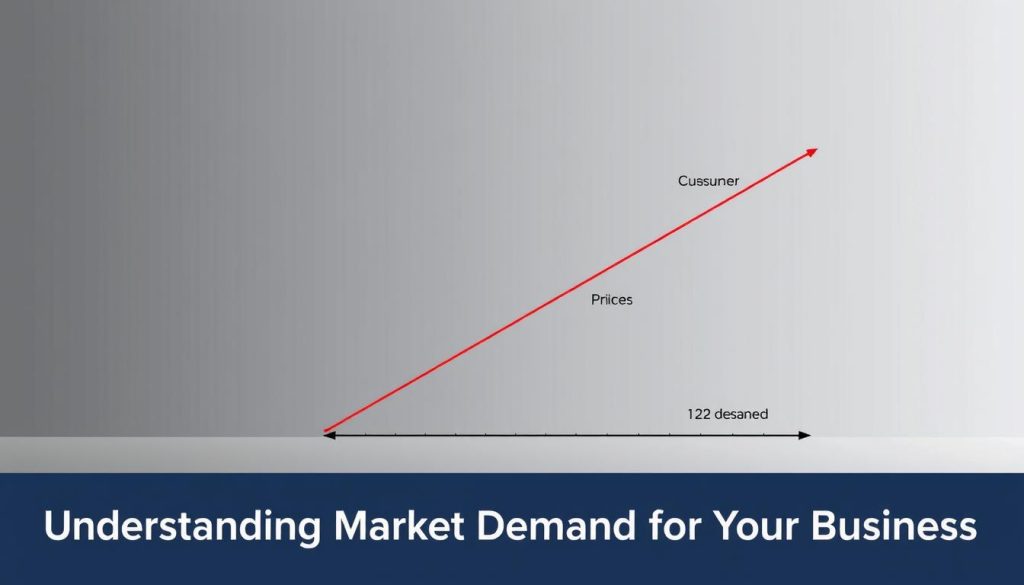
The demand curve visually captures the relationship price has with consumer interest. As prices rise, purchases typically decline—a pattern critical for pricing strategies. Businesses use this to identify optimal price points balancing profitability and accessibility.
| Individual Demand | Aggregate Demand |
|---|---|
| Single consumer’s purchasing intent | Combined demand across all buyers |
| Influenced by personal budget | Shaped by economic trends |
| Varies by preferences | Reflects broader patterns |
The Role of Demand in Business Strategy
Market research validates whether customers can and will pay for your solution. A bakery might survey locals to gauge interest in gluten-free bread before launching it. This step prevents costly missteps by aligning supply with real needs.
Analyzing quantity demanded helps forecast inventory requirements and revenue streams. When paired with competitor data, it reveals gaps where your product can thrive. Tools like Umalis’ simulator automate this analysis, turning complexity into clarity.
Understanding Market Demand for Your Business

What drives people to choose your product over others? To answer this, let’s clarify essential terms that shape strategic planning. These concepts act as building blocks for evaluating opportunities effectively.
Core Principles Explained
Quantity demanded refers to how much customers will purchase at specific price points. For example, French consumers bought 12% more eco-friendly cleaning products last year when prices dropped by €1.50. This metric helps predict inventory needs and revenue streams.
Consumer preferences directly influence success. A Parisian café might notice rising requests for oat milk lattes—a shift requiring menu adjustments. These choices create ripple effects across industries.
| Factors Shifting Demand | Impact | Real-World Example |
|---|---|---|
| Price changes | Immediate effect on sales volume | Smartphone sales surge during holiday discounts |
| Trends | Long-term behavioral shifts | 15% increase in remote work tools post-pandemic |
| Economic shifts | Altered purchasing power | Luxury goods decline during inflation spikes |
| Marketing campaigns | Short-term interest boosts | 35% sales lift after influencer collaborations |
Prices act as both barriers and incentives. A 10% price hike on subscription services often reduces sign-ups but increases per-customer revenue. Finding balance requires testing and analysis.
Strategic marketing reshapes perceptions. Limited-time offers or loyalty programs can temporarily bend the demand curve upward. However, lasting growth stems from aligning with core consumer values like sustainability or convenience.
Mastering these elements transforms guesswork into informed strategy. Next, we’ll explore tools that automate this analysis for precision-driven outcomes.
Leveraging Umalis’ Revenue Simulator
How do you transform raw data into strategic advantage? Umalis’ tool bridges the gap between complex analytics and actionable insights. Designed for professionals seeking clarity, it converts fluctuating variables into clear growth pathways.
How the Simulator Works
The simulator aggregates real-time data from multiple sources—social trends, economic indicators, and customer behavior patterns. Through predictive algorithms, it generates scenarios showing how price adjustments or new products might perform. Users interact with a dashboard that simplifies complex metrics into visual forecasts.
Continuous research happens automatically. The system updates its models as new data emerges, ensuring recommendations stay relevant. For example, a sudden shift in goods availability triggers instant recalculations of optimal pricing strategies.
Benefits of Data-Driven Decision Making
Traditional methods often rely on static reports. Umalis’ approach delivers dynamic insights that evolve with your business. This empowers leaders to:
| Traditional Analysis | Umalis Simulator |
|---|---|
| Manual data collection | Automated real-time updates |
| Generic projections | Customized scenario modeling |
| Delayed adjustments | Instant strategy recalibration |
| Single-source insights | Multi-platform integration |
By identifying emerging customer preferences early, top salary portage income simulators help businesses stay ahead. The tool also evaluates how external factors—like supply chain shifts—impact goods profitability.
Ultimately, it transforms uncertainty into strategy. When you understand not just what’s happening, but why, every decision becomes a calculated step toward growth.
Tools and Strategies for Calculating Market Demand
What separates thriving businesses from those guessing in the dark? The answer lies in precise measurement techniques. Modern tools like Google Keyword Planner and social listening platforms turn abstract concepts into measurable metrics, helping you align offerings with real-world needs.
Using Keyword Research and Social Listening Tools
Start by exploring what your customers actively seek online. For example, a Lyon-based bakery might use Google Trends to discover a 40% quarterly increase in searches for « vegan croissants. » Social listening tools like Brandwatch can track conversations across platforms, revealing emerging preferences like eco-friendly packaging demands.
Analyzing Trends and Data for Accurate Estimation
Combine search data with sales patterns to forecast demand. If « home office desks » spike in Paris during August, inventory planning becomes proactive rather than reactive. Tools like SEMrush’s Market Explorer compare regional markets, showing where your product could gain traction.
| Manual Analysis | Automated Tools |
|---|---|
| Weekly spreadsheet updates | Real-time dashboard alerts |
| Limited regional scope | Global trend comparisons |
| Delayed insights | Predictive modeling |
Track behavioral shifts over time to refine strategies. Monthly reports from HubSpot or Sprout Social highlight seasonal patterns, enabling timely adjustments. This approach transforms fragmented observations into a cohesive growth roadmap.
Interpreting Demand Curves and Consumer Behavior

Why do some pricing strategies succeed while others falter? The answer lies in decoding how people make purchasing decisions. Let’s break down core concepts that reveal why consumers act—and how businesses can respond effectively.
Individual Demand vs. Market Demand
Individual demand reflects one person’s buying habits. For instance, a Parisian freelancer might buy three specialty coffees weekly. But market demand combines millions of these choices into broader patterns. When average income rises in Lyon, citywide spending on premium goods often increases—even if some individuals stick to budgets.
| Individual Behavior | Market Trends |
|---|---|
| Based on personal preferences | Shaped by economic factors |
| Volatile daily choices | Predictable seasonal shifts |
| Limited impact alone | Drives industry-wide changes |
Understanding the Demand Curve Dynamics
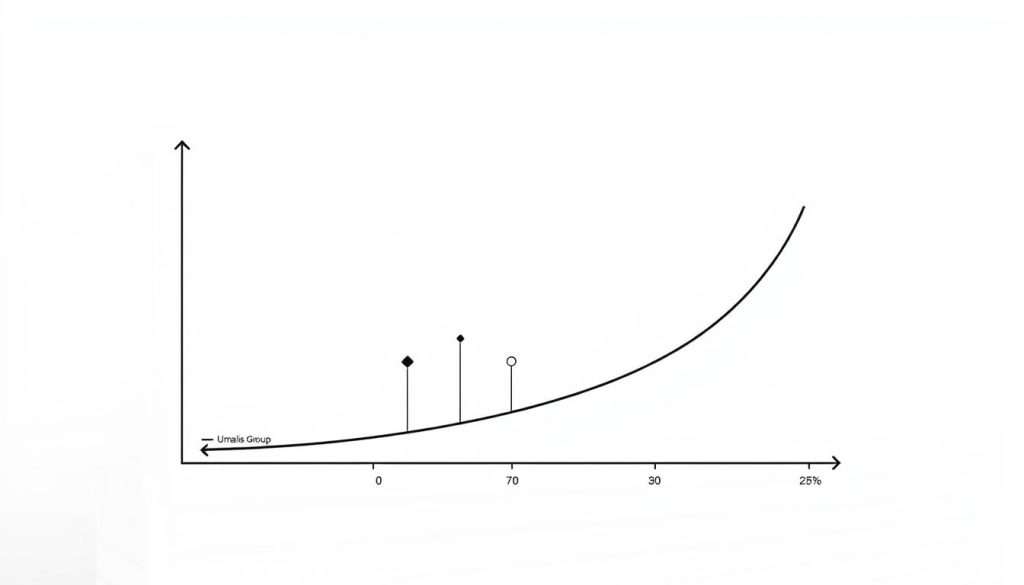
The curve shows how price changes affect purchase volumes. When electric car prices drop 15%, sales typically surge—a clear inverse relationship. But external factors like material shortages can shift the entire curve. Imagine a tech company facing scarce resources: higher production costs might force price hikes, reducing quantity sold.
Here’s a practical strategy: track how your product’s curve reacts to promotions or competitor moves. For example, a 10% discount on software subscriptions often boosts sign-ups temporarily. However, lasting growth requires aligning prices with perceived value and economic conditions.
By mastering these patterns, you transform abstract data into actionable plans. Every price adjustment becomes an informed step toward sustainable growth.
Case Studies and Real-World Applications
Real-world success stories prove how data-driven strategies unlock growth. Let’s examine how businesses transformed insights into measurable results using advanced analytics tools.
Examples of Successful Market Research
A French tech startup used Umalis’ simulator to calculate market demand for smart home devices. By analyzing regional search trends and competitor pricing, they identified a 22% untapped potential in Lyon’s suburbs. The tool’s market demand function accurately predicted sales volumes, leading to a 40% revenue boost in Q1.
| Traditional Approach | Umalis Simulator |
|---|---|
| 6-month manual surveys | Real-time consumer behavior tracking |
| ±15% accuracy margin | 93% forecast precision |
| Localized data only | Multi-region comparison tools |
Lessons from Revenue Simulation in Various Markets
When a Parisian eco-fashion brand tested price adjustments, the simulator revealed a 17% sales increase at €79—not their proposed €89. This highlights why understanding market demand is non-negotiable for pricing strategies.
Another case shows how a Bordeaux wine exporter avoided overproduction. By simulating global preferences, they redirected 30% of inventory to emerging Asian markets. These examples prove market demand crucial insights prevent costly missteps.
Every launch succeeds when backed by evidence. Tools that blend real-time analytics with strategic frameworks turn uncertainty into opportunity.
Conclusion
Mastering market dynamics begins with precise insights. Understanding the total quantity product your audience needs prevents costly overproduction or shortages. This balance ensures your product service aligns with what consumers market realities truly require.
Thorough analysis of quantity product service potential transforms guesswork into strategy. Tools like Umalis’ income simulator decode complex variables, revealing optimal price points where customers remain willing able purchase. This approach respects both budgets and business goals.
A robust demand function acts as your compass in shifting conditions. By simulating scenarios, you gain clarity on how external factors impact product service consumers. These insights empower proactive adjustments rather than reactive fixes.
Ultimately, success lies in merging data with intuition. When strategies stem from verified patterns rather than assumptions, growth becomes predictable. Let informed decisions guide your next move—because certainty is the ultimate competitive edge.
FAQ
How does Umalis’ Revenue Simulator analyze industry needs?
Our simulator uses real-time data from sources like Google Trends and LinkedIn Sales Navigator to model purchasing patterns. It identifies gaps between current supply and consumer interest, helping you prioritize high-opportunity areas while minimizing risk.
Why is tracking consumer behavior critical for freelancers?
Independent professionals rely on anticipating shifts in client preferences. Tools like SEMrush and Brandwatch reveal emerging trends, allowing you to adjust services proactively. This reduces revenue volatility and builds long-term client trust.
What advantages do demand curves offer solopreneurs?
Visualizing price-to-quantity relationships helps set competitive rates without underselling. For example, graphic designers use this data to balance project fees with client budgets, optimizing earnings while maintaining steady workflows.
Can small businesses validate ideas without expensive research?
Absolutely. Platforms like SurveyMonkey and Hotjar provide affordable insights into customer pain points. Combined with Umalis’ forecasting models, you can test concepts like subscription pricing or niche service bundles before full launches.
How do economic factors impact service-based industries?
Variables like disposable income levels or remote work trends directly affect demand for consulting, coaching, or freelance tech support. Our simulator integrates macroeconomic indicators to help you adapt offerings during downturns or expansions.
What mistakes do startups make when estimating client interest?
Common errors include overestimating niche appeal or ignoring regional purchasing power. Tools like SparkToro analyze audience demographics, while case studies from companies like HubSpot illustrate effective demand-validation frameworks.


